Tirzepatide weight loss has an after
The scale at the end of treatment is one measurement. The next chapter belongs in the same account.
Weight reductions in SURMOUNT-1
The 2022 SURMOUNT-1 trial followed 2,539 adults without diabetes for 72 weeks. Eligibility required BMI of at least 30, or at least 27 with a weight-related complication; BMI relates weight to height. Mean body-weight change was -15.0% in the 5 mg study arm, -19.5% in the 10 mg arm and -20.9% in the 15 mg arm, versus -3.1% with placebo.
The size of that change earns my respect. The qualification concerns the particular population, treatment period and set of assigned doses that produced the result. Most gastrointestinal adverse events were mild or moderate and occurred primarily during escalation.
Tirzepatide reduces appetite and food intake through its GIP and GLP-1 actions, alongside glucose-dependent insulin effects and slowed gastric emptying. The physiology review gives the mechanism its due without establishing how much of each person's weight change comes from each receptor. “Burns fat” is too blunt a description of that record.
Tirzepatide vs semaglutide is a specific comparison
The 2025 SURMOUNT-5 head-to-head trial enrolled 751 adults with obesity and without type 2 diabetes. At 72 weeks, mean weight change was -20.2% with tirzepatide and -13.7% with semaglutide, a difference of -6.5 percentage points. Tirzepatide also reduced waist circumference more, and more participants reached weight reductions of at least 10%, 15%, 20% and 25%.
Both arms used maximum tolerated study doses, and gastrointestinal adverse events were the main problem in both groups. The outcome is a comparison of treatments people could tolerate within the protocol. Each person's treatment decision requires more than the best scale result.
The diabetes comparison on the research page used a different semaglutide amount and a different population. I’d leave those boundaries visible instead of blending both trials into one universal ranking.
The lost weight was not all fat
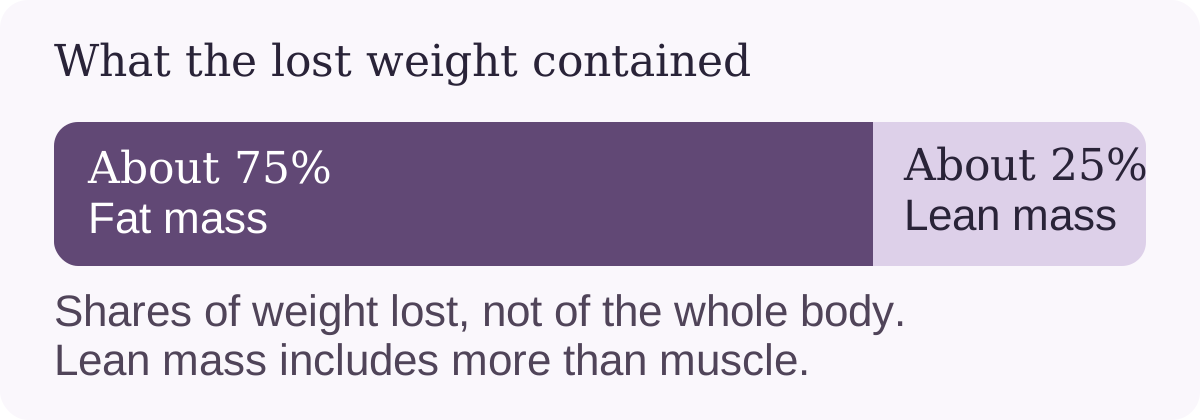
In the SURMOUNT-1 body-composition substudy, about 75% of the weight lost was fat and about 25% was lean mass. Lean mass includes more than skeletal muscle; describing the entire non-fat portion as muscle overstates what the scan measured. The proportions were broadly consistent across clinically relevant subgroups and were similar in the placebo group.
The broader 2026 review of incretin-based weight loss put the median share attributable to muscle-related indices near 28%. It covered different medicines and measurement methods, giving its estimate a different scope from this tirzepatide subgroup. It reported no objective physical-function outcomes.
That leaves a question I consider more useful than the scale alone: how do strength and everyday function change? The review of resistance exercise and body composition discusses muscle preservation and compares rapid lean-mass loss with a decade or more of aging. It offers a narrative comparison; a claim that treatment makes a person age by that amount would exceed its evidence.
Weight regain after withdrawal in SURMOUNT-4
In the 2024 SURMOUNT-4 randomized withdrawal trial, 670 participants were randomized after a 36-week open-label lead-in. They had lost a mean 20.9% before that assignment. From week 36 to week 88, those continuing tirzepatide lost a further 5.5%, while those switched to placebo gained 14.0%.
Those changes use the week-36 starting point. They cannot simply be added to, or subtracted from, the earlier percentage. The reported overall mean reductions from the original baseline to week 88 were 25.3% with continued tirzepatide and 9.9% with placebo.
A review of discontinuation across incretin trials likewise found substantial regain. The 2026 SURMOUNT-4 follow-up associated greater regain with worse cardiometabolic measurements. This is why I give duration a central place in the benefit-and-risk account. None of these findings supplies a personal starting, stopping or tapering plan.
Prediabetes and other medicines complicate the picture
The extended follow-up in adults with obesity and prediabetes found sustained weight reduction and less progression to type 2 diabetes. This does not turn the result into a guarantee of prevention for every person.
The 2026 post hoc analysis of weight-inducing medicines examined SURMOUNT-1, SURMOUNT-3 and SURMOUNT-4. Such medicines were used by 17.4%, 17.3% and 20.0% of participants respectively. In those participants, reported weight changes were -13.3% to -21.3% in the 5 mg to 15 mg SURMOUNT-1 arms at week 72, -26.1% with the maximum tolerated dose in SURMOUNT-3 at week 72, and -18.6% in SURMOUNT-4 at week 88. The results were comparable to the primary findings.
A plateau does not identify its own cause. The 72-week trial trajectory is a group result; a flat personal scale cannot decide whether another medicine, eating pattern, sleep or some other factor explains it. That assessment belongs with the prescribing clinician.